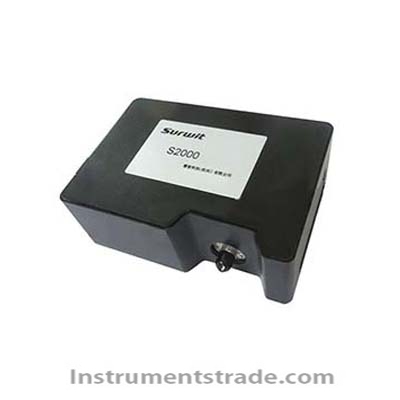
- Model NumberS2000-VIS
- Brand NameHZSAIZHI
- Payment TermsTT,PAYPAL,Alibaba.com Pay
S2000-VIS Fiber Optic Spectrometer
Product Introduction
The S2000-VIS Fiber Optic Spectrometer is a compact visible (VIS) spectrometer designed for high-stability spectral analysis of LEDs, energy-saving lamps, fluorescent lamps, and other light sources. With a wavelength range of 330–1100 nm, a 2048-pixel Sony CCD detector, and 0.2 nm wavelength resolution, it provides reliable spectral data for laboratory and industrial optical measurements.
The S2000-VIS uses USB data acquisition and the SpectraPro software platform for real-time spectrum display, recording, analysis, and data export. Its software supports multiple spectrum display and processing, peak/valley searching, FWHM calculation, coordinate conversion, snapshots, spectrum buffering, and spectral data recording.
Key Features
• Wide VIS spectral range: 330–1100 nm for comprehensive visible and near-infrared spectral analysis.
• 2048-pixel Sony CCD detector: Sony ILX554B CCD provides stable spectral acquisition.
• High wavelength resolution: Up to 0.2 nm.
• High signal-to-noise ratio: S/N ratio up to 300:1.
• Stable USB communication: Built-in anti-interference and USB recovery technology improves long-term operating stability.
• Stable spectral baseline: Dedicated CCD acquisition technology maintains baseline stability even with power fluctuations.
• Compact and lightweight: Approximately 500 g, suitable for laboratory and portable optical measurement setups.
• Flexible fiber coupling: Standard SMA905 fiber interface.
• Wide exposure range: 3 ms to 60 s.
• Convenient spectral analysis software: Supports spectrum comparison, peak/valley search, FWHM, recording, and data export.
• Excel and Word export: Spectrum data can be exported for further analysis and reporting.
Working Principle
The S2000-VIS fiber optic spectrometer receives optical radiation through the SMA905 fiber interface. Light passes through a 30 μm slit and is dispersed by a 600 lines/mm diffraction grating.
The dispersed spectrum is projected onto the Sony ILX554B 2048-pixel CCD detector, where different wavelengths are converted into corresponding electrical signals. A high-precision 16-bit A/D converter digitizes the detector output and transfers the spectral data to a computer through USB.
The SpectraPro software processes and displays the spectrum, enabling users to identify spectral peaks and valleys, calculate FWHM, compare spectra, record measurements, and export spectral data.
The dedicated CCD acquisition circuit also improves baseline stability and measurement reproducibility under power fluctuations and electromagnetic interference.
Technical Specifications
| Parameter |
Specification |
| Model |
S2000-VIS |
| Type |
Fiber Optic VIS Spectrometer |
| Wavelength Range |
330–1100 nm |
| Detector |
Sony ILX554B 2048-pixel CCD |
| Slit Width |
30 μm |
| Grating |
600 lines/mm @ 250 nm |
| Wavelength Resolution |
0.2 nm |
| Signal-to-Noise Ratio |
300:1 |
| Stray Light |
<0.1% |
| CCD Linearity Correction |
99.80% |
| Wavelength Repeatability Error |
<0.2 nm |
| Wavelength Absolute Error |
<0.5 nm |
| A/D Conversion |
16-bit high-precision AD |
| Minimum Exposure Time |
3 ms |
| Maximum Exposure Time |
60 s |
| Power Supply |
5 V DC via PC USB port |
| Power Consumption |
95 mA @ 5 V |
| Communication Interface |
USB 1.1 / USB 2.0 |
| Fiber Interface |
SMA905 |
| Operating Temperature |
-20°C to 60°C |
| Software |
SpectraPro |
| Dimensions |
115 × 80 × 40 mm |
| Weight |
500 g |
Spectral Analysis Software
The SpectraPro software provides an intuitive interface consisting mainly of a control window, spectrum window, and spectrum list window.
Key functions include:
1.Multiple spectrum line display and processing
2.Spectrum snapshot and buffer spectrum
3.Peak and valley searching
4.FWHM calculation
5.Coordinate conversion
6.Spectrum recording and comparison
7.Spectrum graphic display and file management
8.Text labeling and mouse-based spectrum inspection
9.Export of spectral data to Excel and Word
10.Proprietary .ssp spectrum file format
Applications
LED Spectrum Analysis
Used to analyze emission spectra, peak wavelengths, spectral distribution, and other optical characteristics of LED light sources.
Energy-Saving Lamp Testing
Suitable for spectral analysis and comparison of energy-saving lamps and related lighting products.
Fluorescent Lamp Analysis
Provides wavelength-resolved spectral measurements for fluorescent lamps and other discharge-based light sources.
Light Source Characterization
Useful for evaluating spectral output, peak positions, spectral bandwidth, and overall spectral distribution.
Laboratory Optical Research
Suitable for teaching, research, optical experiments, and general-purpose visible spectral analysis.
S2000-VIS vs. Conventional VIS Spectrometer
| Feature |
S2000-VIS |
Conventional VIS Spectrometer |
| Wavelength Range |
330–1100 nm |
Varies |
| Detector |
2048-pixel Sony CCD |
Varies |
| Resolution |
0.2 nm |
Varies |
| S/N Ratio |
300:1 |
Varies |
| Fiber Interface |
SMA905 |
Depends on model |
| USB Communication |
USB 1.1/2.0 |
Varies |
| Baseline Stability |
Dedicated CCD acquisition technology |
Depends on design |
| USB Interference Protection |
Built-in anti-interference/recovery |
Not always available |
| Exposure Time |
3 ms–60 s |
Varies |
| Weight |
500 g |
Often heavier |
| Spectrum Data Export |
Excel / Word |
Depends on software |
Frequently Asked Questions (FAQ)
1. What wavelength range does the S2000-VIS spectrometer cover?
The S2000-VIS covers 330–1100 nm, making it suitable for visible and near-infrared spectral analysis.
2. What detector does the S2000-VIS use?
It uses a Sony ILX554B 2048-pixel CCD detector for spectral data acquisition.
3. What is the wavelength resolution?
The specified wavelength resolution is 0.2 nm, with wavelength repeatability error below 0.2 nm.
4. What light sources can the S2000-VIS analyze?
It is designed for LEDs, energy-saving lamps, fluorescent lamps, and many other light sources requiring spectral analysis.
5. How does the spectrometer connect to a computer?
The S2000-VIS uses a USB 1.1 or USB 2.0 interface and can receive 5 V power directly from the PC USB port.
6. What fiber interface is provided?
The standard optical fiber interface is SMA905.
7. What spectral analysis functions does the software provide?
SpectraPro supports peak/valley searching, FWHM calculation, spectrum comparison and processing, snapshots, spectrum buffering, coordinate conversion, spectrum recording, and data export.
8. Can spectral data be exported for further processing?
Yes. Spectrum data can be exported to Excel and Word, while measurement spectra can also be saved in the proprietary .ssp format.
9. Is the S2000-VIS suitable for long-term continuous operation?
Yes. Its USB communication protection, built-in USB recovery function, and dedicated CCD acquisition technology improve communication and baseline stability, supporting reliable continuous operation.