ZS 0 Maze Video Analysis System Introduction: The O-Maze (referred to as Zero Maze in the literature) divides a circular area into four equal sections, alternating between high-barrier and barrier-free areas. By measuring the activity ratio in the high-barrier area (psychological safety zone) and the barrier-free area (danger zone), as well as the number of entries into the danger zone, the anxiety levels (stemming from the natural tendency to seek benefits and avoid harms, as well as the desire to explore the unknown) among different individuals can be quantitatively compared. The O-Maze (Zero Maze) is a relatively new method for anxiety research, and its results are reliable. This product utilizes video tracking technology to automate and quantify the O-Maze (Zero Maze) experiment, resulting in more authentic, credible, and objective outcomes. Technical parameters: Hardware parameters: Zero maze rat: outer diameter of 1000 mm, arm width of 100 mm, arm height of 300 mm, Zero maze mouse: outer diameter of 500 mm, arm width of 60 mm, arm height of 150 mm, The height of the base above the ground is: 500 mm Material: Industrial-grade aluminum profile and special medical ABS engineering board The O-maze (zero maze) structure meets domestic and international setup standards, providing an experimental environment for rats and mice, and is primarily used for measuring animal anxiety behavior. Camera parameters: Camera: gun-type Color: Color/Black and White Camera resolution ≥ 640*480 Camera compatible power supply: DC 12V Camera type: 2.8-12mm zoom Software parameters: 1. One-click drawing of regions The labmaze center-point drawing method facilitates the creation of the maze area required for experiments. After the experiment is completed, if it is discovered that a certain area has not been drawn, it can be temporarily added without the need to reanalyze the video. The software can directly obtain the metrics for this area. 2. Intelligent AI algorithm The software autonomously identifies the volume and shape of animals through learning and extracts and saves them from complex backgrounds. It has strong anti-interference and filtering capabilities, and can accurately track animals even with significant interference from ripples in the image. Tracking method: Tracking three points: the tip of the nose, the center, and the base of the tail, and simultaneously analyzing the corresponding data of these three points, etc 3. Diversification of experimental process design The software allows for open editing based on conditions such as time, region, speed, hardware, steps, and events, making it convenient to edit and create any experimental process mentioned in literature 4. Human-computer interaction verification The software automatically saves the experimental process video, and the experimental video and analysis indicators can be played back simultaneously in the same window, verifying the consistency between software analysis and manual calculation and ensuring the authenticity of the analysis results. 5. Rich statistical indicators The software can analyze over 200 indicators, including visit frequency, dwell time, percentage, moving distance, speed, inter-zone transitions, trajectory maps, time-series charts, heat maps, event relationships, and more, for each quadrant or area; 6. GLP management The software features a permission management function, allowing administrators to assign experimental user accounts and manage user permissions; and to review the operations of experimenters 7. Strong compatibility and scalability Strong compatibility: It can be used to build a platform with similar products from other domestic and foreign brands. It facilitates future platform expansion and upgrades, and no additional costs will be incurred for secondary software expansion; 8. The software allows installation on multiple computers and works on laptops. It supports both online and offline video analysis, facilitating data metric statistics; 9. Data indicators: time, distance, entry count for each area, activity percentage in each area, trajectory map, heat map.
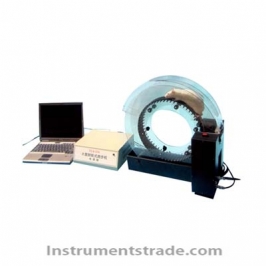
ZS 0 Maze Video Analysis System Introduction: The O-Maze (referred to as Zero Maze in the literature) divides a circular area into four equal sections, alternating between high-barrier and barrier-free areas. By measuring the activity ratio in the high-barrier area (psychological safety zone) and the barrier-free area (danger zone), as well as the number of entries into the danger zone, the anxiety levels (stemming from the natural tendency to seek benefits and avoid harms, as well as the desire to explore the unknown) among different individuals can be quantitatively compared. The O-Maze (Zero Maze) is a relatively new method for anxiety research, and its results are reliable. This product utilizes video tracking technology to automate and quantify the O-Maze (Zero Maze) experiment, resulting in more authentic, credible, and objective outcomes.