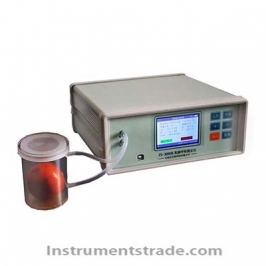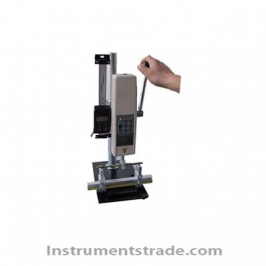
PhenoGA Plant Phenotyping Analyzer

Product ID:SHZWqtzwyq006

Price: Please inquire PDF Format
Supply Ability:50 SETS/MON
Port:SHENZHEN
  • Product Introduction
  • Other information
  • Model NumberPhenoGA
    Brand NameHZWANSHEN
    Payment TermsTT,PAYPAL,Alibaba.com Pay
    PhenoGA Plant Phenotyping Analyzer
     
    Product Introduction
    The PhenoGA Plant Phenotyping Analyzer is an advanced automated plant phenotype measurement and image analysis system designed for plant genetics, phenotyping, environmental response research, crop breeding and plant growth studies.
    Plant phenotype is jointly influenced by genotype and environmental conditions. Accurate and large-volume phenotype data are therefore essential for connecting genetic variation with measurable plant traits. Traditional manual measurements can be affected by operators, instruments and environmental conditions, while repeated measurements may damage plants.
    PhenoGA addresses these limitations through non-destructive RGB imaging, 3D depth imaging and automated image analysis. The system combines top-view and side-view high-resolution color imaging with active infrared binocular 3D imaging to generate detailed plant phenotype data throughout different growth stages.
    It can measure plant height, projected leaf area, leaf number, leaf length and curvature, canopy architecture, stem-leaf angles, growth rate, leaf color, root traits, seed morphology and many other parameters.


    Performance Features
    •  Top + Side RGB Imaging: Automatically captures top and side RGB color images using a 24.2-megapixel Canon EOS DSLR camera with automatic focusing.
    •  3D Plant Imaging: Active infrared binocular 3D camera captures canopy depth and pseudo-color 3D point-cloud data.
    •  3D Reconstruction: Supports multi-view 3D reconstruction and view-angle conversion.
    • Non-Destructive Measurement: Enables repeated phenotype measurement during plant growth without damaging the plant.
    •  Automated Phenotype Analysis: Approximately 1 sample/minute for automatic analysis, with mouse-based measurement and correction when required.
    •  High Measurement Accuracy: Plant height measurement error ≤±2 mm; canopy dimension measurement error ≤±2 mm; true stem-leaf angle repeatability error ≤±1.0°.
    •  Automatic Leaf Counting: Automatically counts leaves with individual mouse correction capability.
    •  Advanced Color Analysis: Supports RGB and LAB color values, automatic leaf-color correction and RHS 2015 color card comparison.
    •  Growth Analysis: Generates absolute growth, relative growth and growth trend curves.
    •  Root Analysis: Measures root length, root thickness and root tips when root diameter is >1 mm.
    •  Crop-Specific Analysis: Provides dedicated maize plant architecture analysis.
    •  Seed and Fruit Analysis: Supports seed number, area, length and width, as well as seed, fruit and flower morphology analysis.
    •  Barcode Tracking: Optional barcode scanner enables automatic sample ID entry and barcode-based tracking.
    •  Batch Analysis: Supports automatic batch processing at different plant growth stages and multi-plant grid analysis.
    •  Editable Results: Measurement results and image markers can be manually edited or corrected.
    •  Data Export: Analysis data and annotated images can be exported.


    Working Principle
    The PhenoGA system combines 2D RGB imaging and 3D depth imaging to obtain comprehensive plant phenotype information.
    The top and side cameras automatically capture high-resolution RGB images of the plant. Image-processing algorithms then identify plant contours, leaves, stems and other visual characteristics to calculate morphological and color-related parameters.
    An active infrared binocular 3D camera simultaneously obtains depth information and generates a 3D point cloud and pseudo-color depth image. The 3D data are used to reconstruct plant architecture and calculate spatial characteristics such as canopy dimensions, plant height and stem-leaf angles.
    The system automatically analyzes the acquired images and generates phenotype data. Researchers can also use mouse-based tools to perform additional geometric measurements or correct automatically identified features.


    Plant Phenotype Analysis Functions
    1. Conventional Morphological Analysis
    PhenoGA can analyze:
    •  Projected leaf area and dynamic changes
    •  Outer perimeter
    •  Circumscribed circle diameter and area
    •  Fitted ellipse major/minor axes and rotation angle
    •  Convex hull diameter, area and perimeter
    •  Plant height and width
    •  Minimum bounding rectangle length and width
    •  Plant compactness
    2. Color Analysis
    The system supports:
    •  RGB color values
    •  LAB color values
    •  Automatic leaf-color correction
    •  Automatic color matching based on the RHS 2015 color chart
    •  Color clustering and segmentation based on specified color numbers
    •  Color distribution analysis
    •  Color-area percentage analysis
    3. Skeleton Analysis
    Skeleton-based analysis includes:
    •  Skeleton length
    •  Number of endpoints, representing leaf count
    •  Number of branches
    •  Number of nodes/internodes
    •  Stem-leaf angles
    4. Maize Plant Architecture Analysis
    For maize, the system can analyze:
    •  Leaf number
    •  Leaf length and width
    •  Leaf curvature
    •  Projected leaf area
    •  Stem node number
    •  Internode length and thickness
    •  Leaf color
    5. Growth Analysis
    PhenoGA supports longitudinal plant growth analysis, including:
    •  Absolute plant growth
    •  Relative growth
    •  Relative growth curves
    •  Growth trends
    •  Dynamic changes in plant height and canopy characteristics
    6. Root Analysis
    Root phenotype analysis includes:
    •  Root length
    •  Root thickness
    •  Root tip number
    Root analysis requires root diameter >1 mm.
    7. Seed and Flower Analysis
    The system can analyze:
    •  Seed number
    •  Seed area
    •  Seed length and width
    •  Seed morphology
    •  Fruit appearance and quality characteristics
    •  Flower shape
    •  Flower color
    Seed analysis requires seed diameter >2 mm and non-overlapping seeds.


    Technical Parameters
    Parameter Specification
    Model PhenoGA
    Imaging Configuration Top View + Side View
    RGB Camera Canon EOS DSLR
    RGB Resolution 24.2 megapixels
    RGB Imaging Top and side RGB color images
    3D Camera Active infrared binocular 3D camera
    3D Point Cloud Density 512 × 424 pixels
    3D Output Depth pseudo-color image and 3D reconstructed pseudo-color image
    Plant Height Measurement Error ≤±2 mm
    Canopy Dimension Measurement Error ≤±2 mm
    Stem-Leaf Angle Repeatability Error ≤±1.0°
    Automatic Analysis Speed Approx. 1 sample/minute
    Standard Maximum Plant Height 150 cm
    Maximum Measurable Canopy 115 × 115 cm
    Imaging Chamber Dimensions 200 cm H × 120 cm L × 120 cm W
    Sample Identification Optional barcode scanner
    Data Output Analysis data and annotated images
    Measurement Editing Supported
    Batch Processing Supported
    Multi-Plant Grid Analysis Supported


    Application Scenarios
    The PhenoGA Plant Phenotyping Analyzer is suitable for:
    •  Plant Genetics Research – Linking genotype variation with measurable phenotype traits.
    •  Plant Breeding – High-throughput phenotype acquisition for breeding programs.
    •  Crop Phenotyping – Quantitative analysis of crop morphology and growth characteristics.
    • Stress Response Research – Evaluation of plant responses to environmental and biological stress.
    •  Ecotoxicology Testing – Quantitative phenotype assessment under environmental exposure.
    • Germination Studies – Automated morphological and growth measurements.
    •  Mutant Screening – Rapid comparison and screening of plant mutants.
    •  Plant Morphology Modeling – 2D and 3D characterization of plant architecture.
    • Plant Growth Research – Longitudinal measurement of growth dynamics.
    •  Maize Phenotyping – Detailed analysis of maize leaves, stems, internodes and plant architecture.
    • Seed and Fruit Research – Automated measurement of seed morphology, fruit appearance and flower characteristics.


    PhenoGA vs. Conventional Manual Plant Phenotyping
    Feature PhenoGA Plant Phenotyping Analyzer Conventional Manual Measurement
    Measurement Method Automated image analysis Manual measurement
    Plant Damage Non-destructive imaging May require physical contact or sampling
    Imaging 2D RGB + 3D depth imaging Usually visual/manual
    Plant Height Automated, ≤±2 mm error Operator dependent
    Canopy Analysis Automated Time-consuming manual measurement
    Leaf Counting Automatic + manual correction Manual counting
    Color Analysis RGB/LAB + RHS 2015 matching Visual comparison
    Growth Tracking Automated dynamic analysis Repeated manual records
    3D Architecture 3D reconstruction available Usually unavailable
    Batch Processing Supported Limited
    Barcode Tracking Supported Usually manual
    Data Export Analysis data + annotated images Manual data recording
    Measurement Repeatability Image-based standardized analysis More affected by operator


    FAQ
    1. What is the PhenoGA Plant Phenotyping Analyzer used for?
    It is designed for automated, non-destructive measurement and analysis of plant phenotypes, including morphology, growth, color, canopy architecture, roots and seed traits.
    2. What imaging technologies does PhenoGA use?
    It combines top- and side-view RGB imaging with an active infrared binocular 3D camera for comprehensive 2D and 3D plant analysis.
    3. What plant traits can be measured?
    The system can measure plant height, projected leaf area, leaf number, leaf length, leaf curvature, canopy dimensions, stem-leaf angle, internode characteristics, growth rate, leaf color and other phenotype traits.
    4. Can PhenoGA perform 3D plant analysis?
    Yes. The 3D camera generates depth pseudo-color images and 3D reconstructed pseudo-color images for plant architecture analysis.
    5. How accurate is plant height measurement?
    The specified plant height measurement error is ≤±2 mm.
    6. Can the system analyze plant color?
    Yes. It supports RGB and LAB color analysis, automatic leaf-color correction and automatic comparison with the RHS 2015 color chart.
    7. Can PhenoGA analyze maize plants?
    Yes. Dedicated maize plant architecture analysis can measure leaf number, leaf length and width, leaf curvature, projected leaf area, stem node number, internode characteristics and leaf color.
    8. Can it analyze roots and seeds?
    Yes. Root analysis includes root length, thickness and root tips when root diameter is >1 mm. Seed analysis includes number, area, length and width when seed diameter is >2 mm and seeds are not overlapping.
    9. How fast can the system analyze samples?
    Automatic analysis can process approximately one sample per minute, with mouse-based measurement or correction available when necessary.


  • FAQ
    1. What is the PhenoGA Plant Phenotyping Analyzer used for?
    It is designed for automated, non-destructive measurement and analysis of plant phenotypes, including morphology, growth, color, canopy architecture, roots and seed traits.
    2. What imaging technologies does PhenoGA use?
    It combines top- and side-view RGB imaging with an active infrared binocular 3D camera for comprehensive 2D and 3D plant analysis.
    3. What plant traits can be measured?
    The system can measure plant height, projected leaf area, leaf number, leaf length, leaf curvature, canopy dimensions, stem-leaf angle, internode characteristics, growth rate, leaf color and other phenotype traits.
    4. Can PhenoGA perform 3D plant analysis?
    Yes. The 3D camera generates depth pseudo-color images and 3D reconstructed pseudo-color images for plant architecture analysis.
    5. How accurate is plant height measurement?
    The specified plant height measurement error is ≤±2 mm.
    6. Can the system analyze plant color?
    Yes. It supports RGB and LAB color analysis, automatic leaf-color correction and automatic comparison with the RHS 2015 color chart.
    7. Can PhenoGA analyze maize plants?
    Yes. Dedicated maize plant architecture analysis can measure leaf number, leaf length and width, leaf curvature, projected leaf area, stem node number, internode characteristics and leaf color.
    8. Can it analyze roots and seeds?
    Yes. Root analysis includes root length, thickness and root tips when root diameter is >1 mm. Seed analysis includes number, area, length and width when seed diameter is >2 mm and seeds are not overlapping.
    9. How fast can the system analyze samples?
    Automatic analysis can process approximately one sample per minute, with mouse-based measurement or correction available when necessary.


Products
Analytical instruments
Physical property test
Environmental monitoring and analysis
Lab general equipment
About us
About this website
Our service
Product purchase
Contact Us

Newsletter

Make Sure you dont miss interesting happenings by joining our newsletter program.

Contact Us
+86-18620722006
instruments@instrumentstrade.com