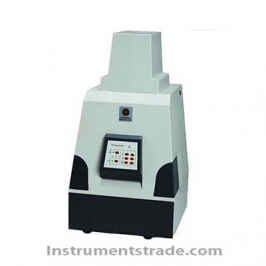
DY-2018MD chemiluminescence imaging analysis system Features
1. With real-time image acquisition software for nucleic acid, protein electrophoresis gel images and chemiluminescence image acquisition
2. With automatic exposure, real-time automatic exposure
3. Software with image automatic optimization function, automatically adjust histogram
4. You can also manually adjust the picture grayscale in the shooting interface and save it.
5. Pre-defined parameter settings can set the experiment performer's storage path in advance, and can set black and white inversion, horizontal inversion, and vertical inversion;
6. Cumulative exposure multiple imaging function: It can image multiple times in a long exposure time, and the exposure time of each imaging can be accumulated, thus avoiding repeated exposure, and the user can select the most desirable image to save.
7. With image management function, it can realize black and white inversion and mark superposition function. It can adjust the color level manually and save the modified picture.
8. With analysis software, automatic strip detection, automatic molecular weight measurement, automatic strip concentration measurement, relative content percentage analysis, absolute concentration, density calculation
9. With a series of image analysis functions such as rotation, reverse color, cropping, contrast, etc., the molecular weight, OD value and band content of any strip can be automatically calculated according to the Marker strip; the optical density calculation can be performed on the specified area, which is suitable for Protein quantitative analysis; all analysis results and data charts can be exported to Excel, Word and other document processing software for easy storage and comparison. Technical Parameters
Model No. : DY-2018MA/ DY-2018MD
Resolution: 1.4 million pixels / 6.05 million pixels
CCD size: 2/3", progressive scan / 1", progressive scan
Cooling temperature : adjustable to -60 ° C
Pixel size: 6.45μm*6.45μm / 4.65μm*4.65μm
Number of digits collected : 16bit
Lens : F0.85 fixed focus
Readout noise: 4-5e-rms / 4-5e-rms
Dark current: <0.01 e-/pixel/sec @ -25oC
White light reflection: Brightness adjustable double-sided LED integrated light source
Full well capacity: 18,000e
Nonlinearity: <1%
Exposure time: 0.1ms-6000s
Quantum efficiency: 95% (590nm)
Control system: external brand computer, easy to process results
Applicable test: ECL\ECL plus, CDP-Star, SuperSignal, CSPD, LumiGLO and other luminescent substrates
Shooting area: 192*246mm
White light reflector: LED white light reflection, adjustable brightness
Features
1. With real-time image acquisition software for nucleic acid, protein electrophoresis gel images and chemiluminescence image acquisition
2. With automatic exposure, real-time automatic exposure
3. Software with image automatic optimization function, automatically adjust histogram
4. You can also manually adjust the picture grayscale in the shooting interface and save it.
5. Pre-defined parameter settings can set the experiment performer's storage path in advance, and can set black and white inversion, horizontal inversion, and vertical inversion;
6. Cumulative exposure multiple imaging function: It can image multiple times in a long exposure time, and the exposure time of each imaging can be accumulated, thus avoiding repeated exposure, and the user can select the most desirable image to save.
7. With image management function, it can realize black and white inversion and mark superposition function. It can adjust the color level manually and save the modified picture.
8. With analysis software, automatic strip detection, automatic molecular weight measurement, automatic strip concentration measurement, relative content percentage analysis, absolute concentration, density calculation
9. With a series of image analysis functions such as rotation, reverse color, cropping, contrast, etc., the molecular weight, OD value and band content of any strip can be automatically calculated according to the Marker strip; the optical density calculation can be performed on the specified area, which is suitable for Protein quantitative analysis; all analysis results and data charts can be exported to Excel, Word and other document processing software for easy storage and comparison.